Startup Fundraising Cheatsheet
New fundraising cheatsheet for founders in 2025.
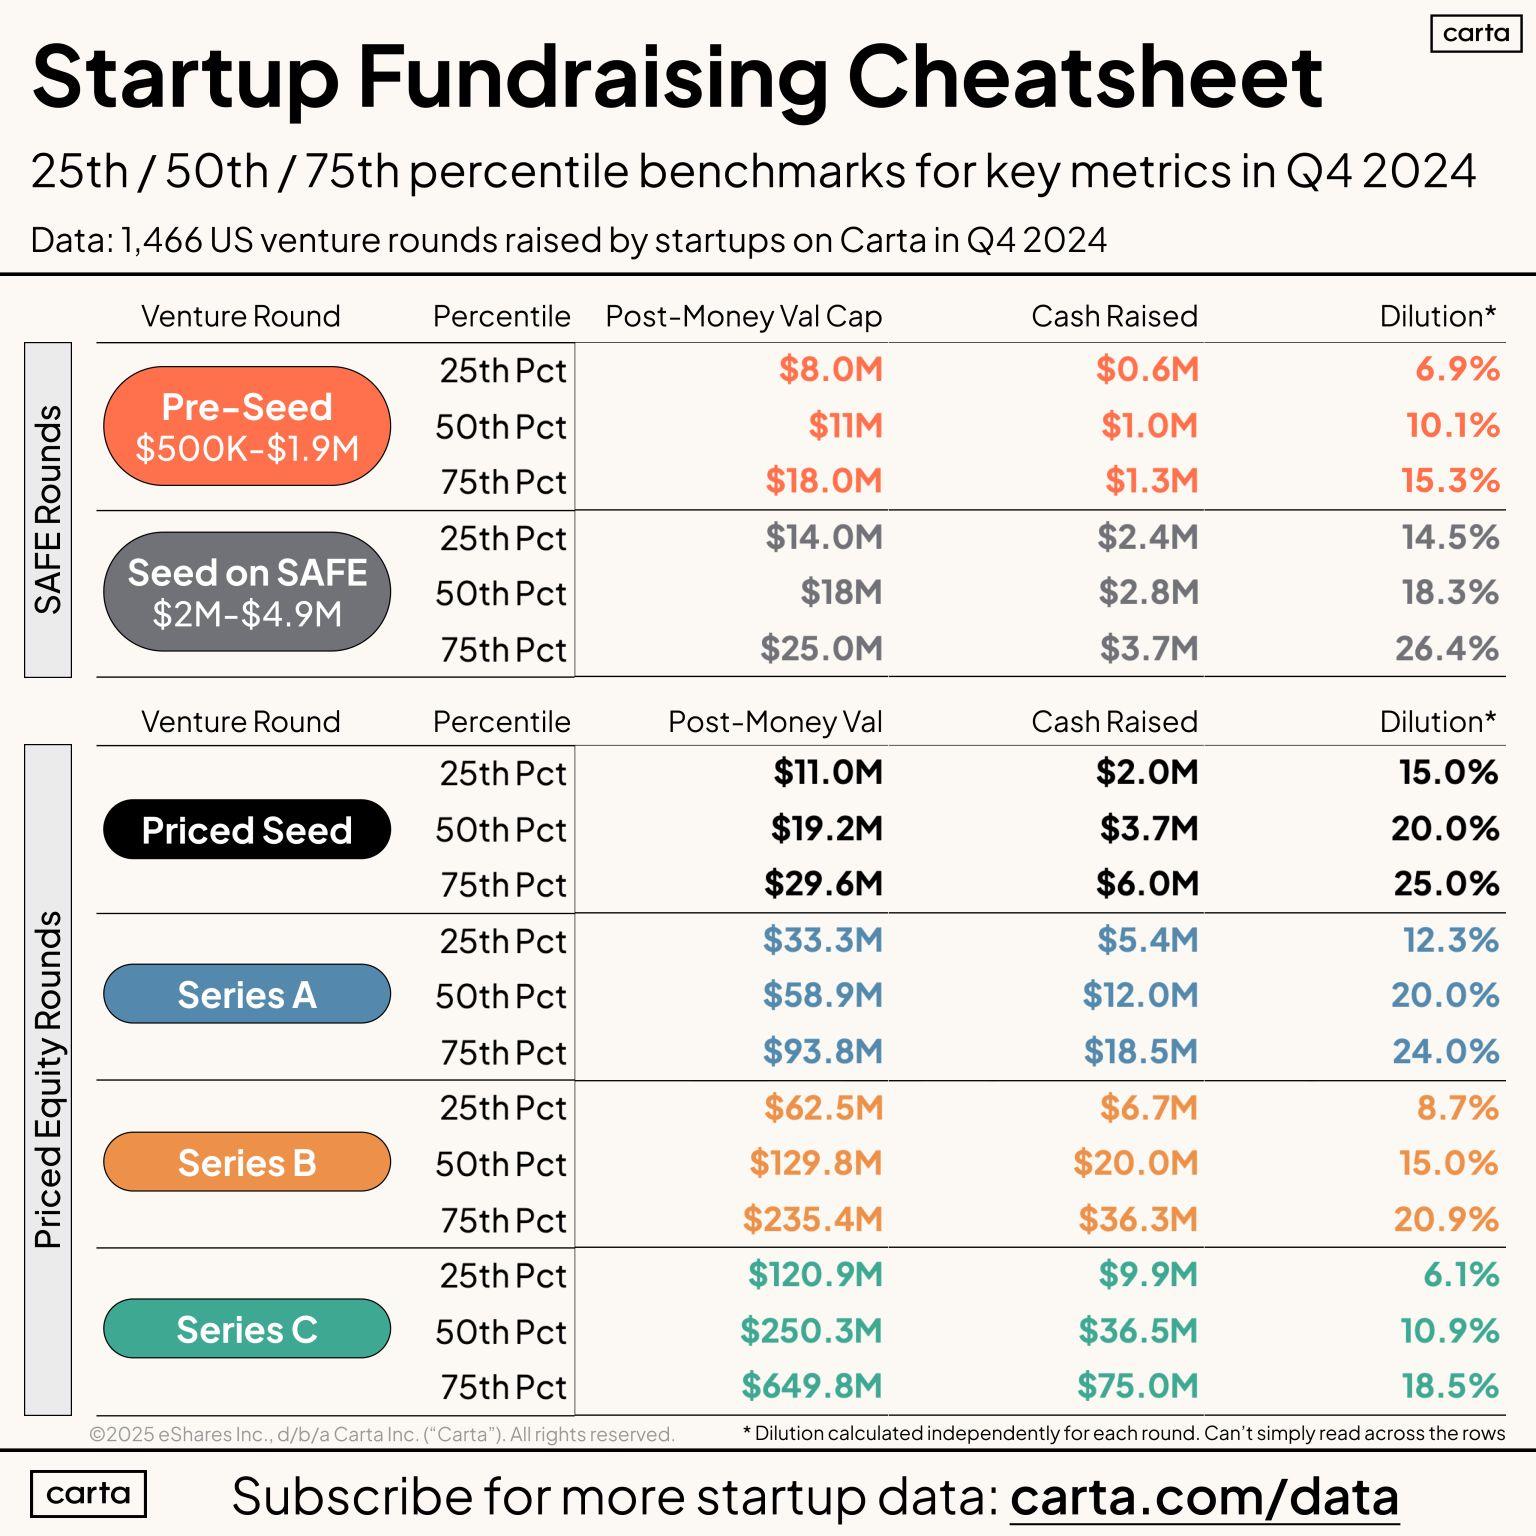
Covers median valuation, cash raised, and dilution (or expected dilution) for each stage of the early fundraising journey - including the data on SAFE raises.
Data from 1.466 rounds in Q4 2024, excludes all bridge rounds.
Post-money SAFEs for the first two sections, primary priced rounds for the bottom two. All data for US tech startups only 🙏
Note that for SAFE rounds we used post-money valuation cap and for price rounds we used actual post-money valuation. Those two measures are related but not the same!
To the data:
𝗣𝗿𝗲-𝗦𝗲𝗲𝗱 ($𝟱𝟬𝟬𝗞-$𝟭.𝟵𝗠 𝗿𝗮𝗶𝘀𝗲𝗱)
• $10M val cap
• $1M raised
• 10.1% dilution (upon the completion of a priced round)
𝗦𝗲𝗲𝗱 𝗼𝗻 𝗦𝗔𝗙𝗘𝘀 ($𝟮𝗠-$𝟰.𝟵𝗠 𝗿𝗮𝗶𝘀𝗲𝗱)
• $18M val cap (median)
• $2.8M raised
• 18.3% implied dilution
𝗣𝗿𝗶𝗰𝗲𝗱 𝗦𝗲𝗲𝗱 𝗥𝗼𝘂𝗻𝗱
• $19.2M post-money valuation
• $3.7M raised
• 20.0% dilution
𝗦𝗲𝗿𝗶𝗲𝘀 𝗔
• $58.9M post-money valuation median
• $12M raised
• 20.0% dilution
𝗦𝗲𝗿𝗶𝗲𝘀 𝗕
• $129.8M post-money valuation median
• $20M raised
• 15.0% dilution
Of course these are medians, so many rounds happening above and below these figures. Dynamics for each raise are unique, dictated by sector, founder profile, fund economics, etc etc. These include many AI company rounds which tend to bump up the medians.
But hopefully these give founders (and investors) a sense of the current baselines.
Subscribe for more Carta data out weekly in our Data Minute newsletter: https://lnkd.in/gNa_Dk-F
------------------------------
Peter Walker
------------------------------